Data visualizations
infographic
This Infographic was designed to highlight the economic impact of e-commerce in China. This infographic was used as visual aid for a research project conducted by Teju Ram and myself.
Tools: Adobe Illustrator

conference poster
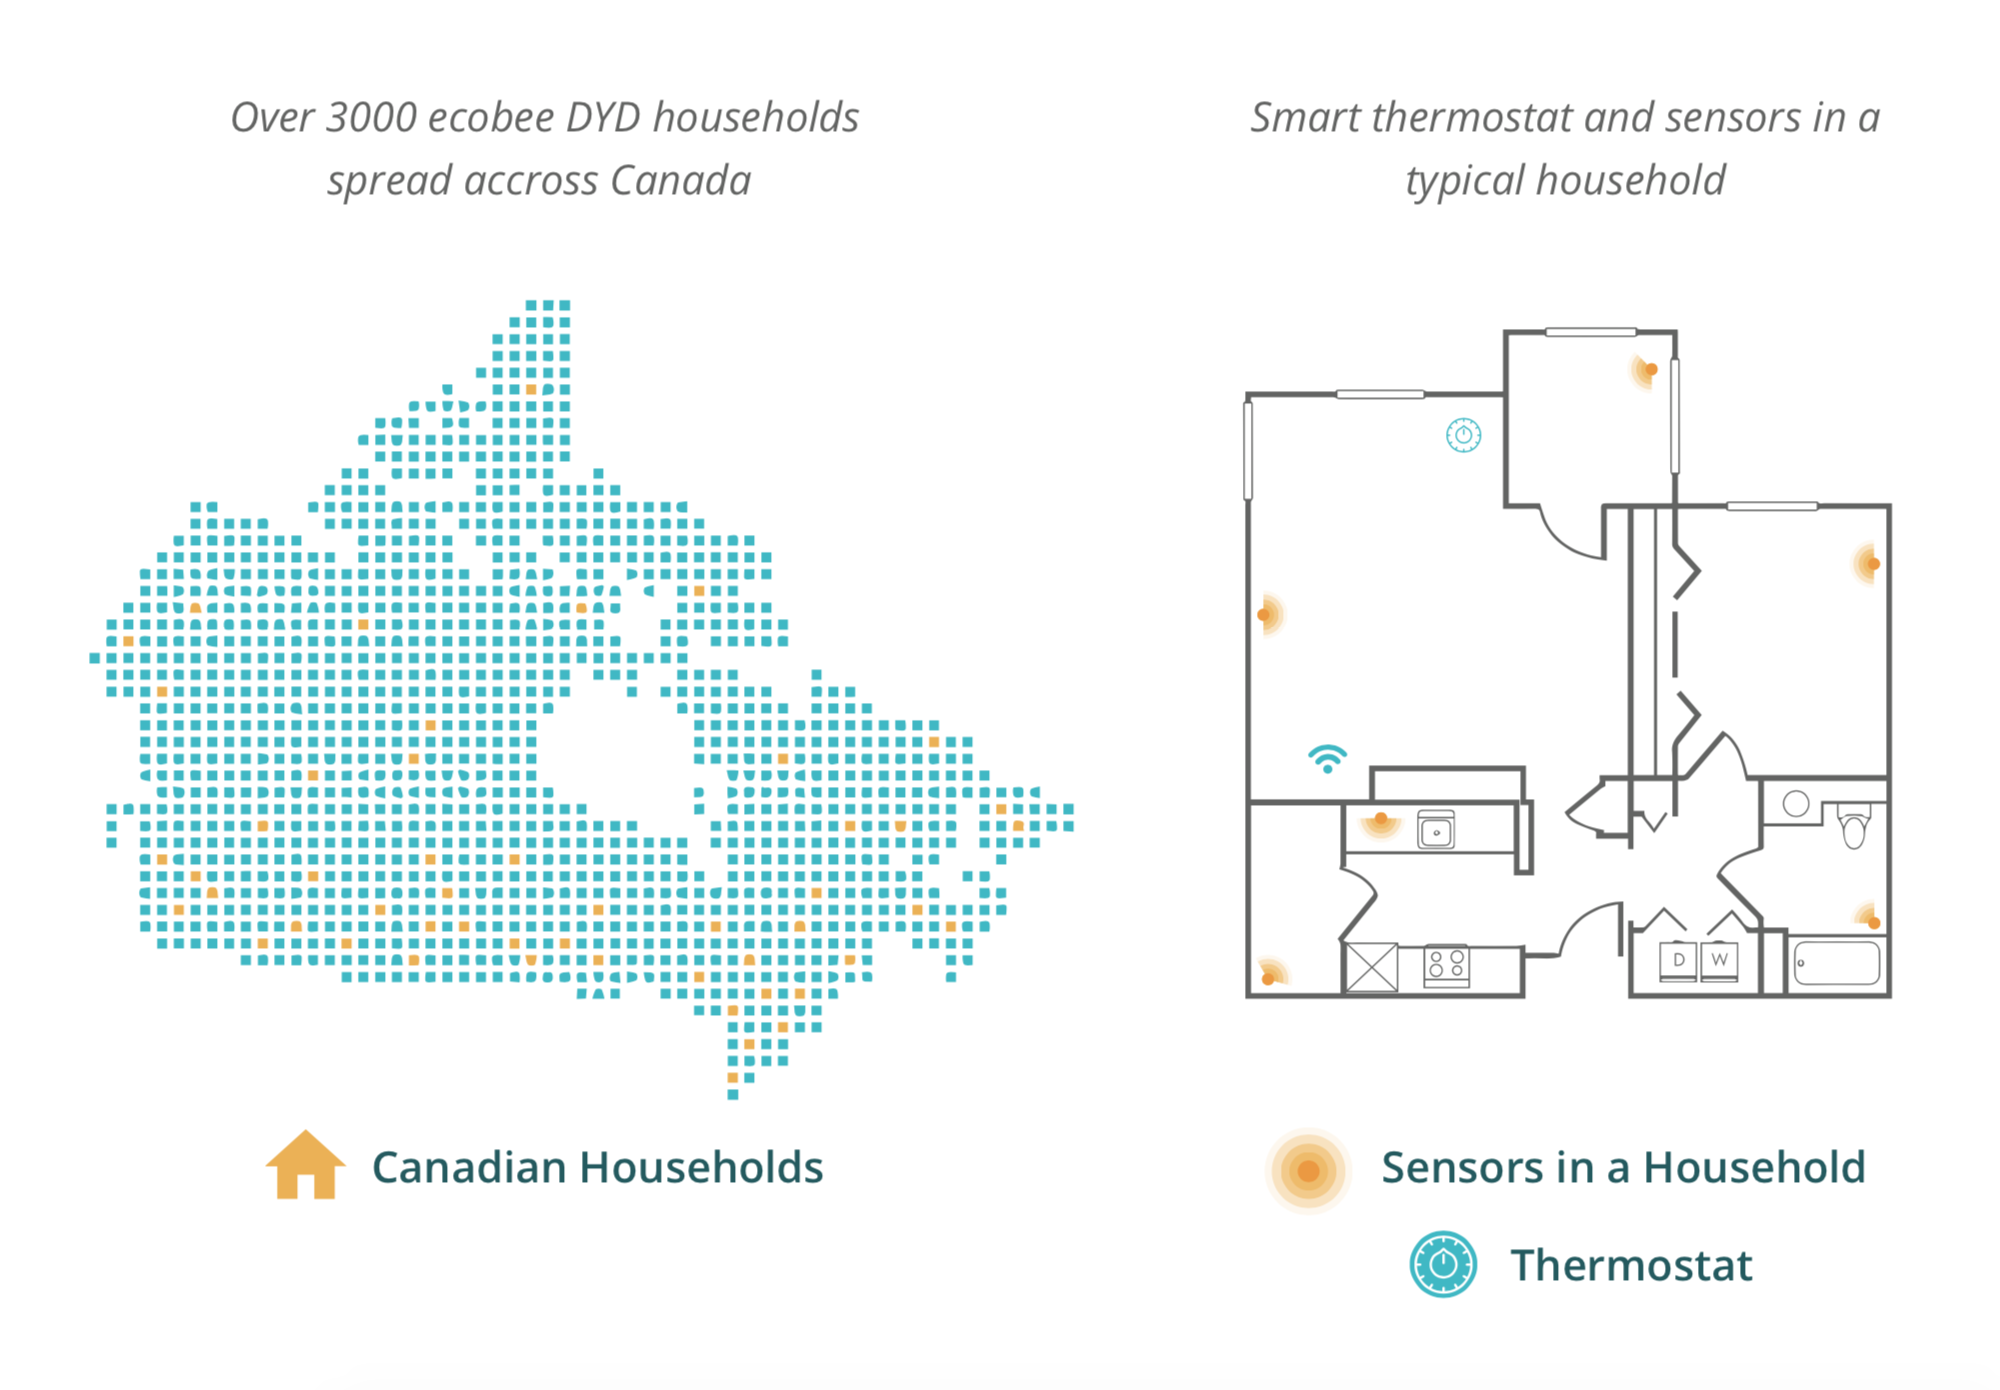
This poster uses visual aids to communicate the use of Ecobee’s Smart Thermostat Technology to monitor and track patient health patterns and behaviours. For this poster, I worked closely with health scientist to understand the data and turn that into a comprehensible visualization.
Tools: Adobe Illustrator